Tuesday, November 29, 2011

Google Docs & Google Forms -- some ideas on labs and other uses

On the ESPRIT listserv (a list with over 1,000 Earth science teachers subscribed) there was a query this morning on using Google Docs for labs. This coupled with my recent realization that you can easily email a Google Form made me think folks might find it useful to put those things together. A Google Form will feed into an associated Google Spreadsheet.

I can envision ways folks might use this for the sharing of lab data and also for assessment. The Google Form link above (and right here) takes you to Google's site on using forms in education that I looked at only after writing much of this. Happily, what I've written complements rather than repeats that information.

You could put lab/worksheet/test questions into a Google Form and email it to the class. Then you can easily see how many people responded to a particular item in a particular way. For questions with one correct answer, you could even set up formulas to have the spreadsheet grade it for you. Of course, tests wouldn't be very secure as kids could email the form to their friends, so you'd need to think through how to deal with that issue. The Google site on Apps in Education has insights on some of these issues here.

Update: When I shared this through Facebook, Aida Awad pointed out a resource for grading in Google Forms. Here's what she said:
So much you can do with Google forms in Geoscience classrooms .... check out self-grading forms using Flubaroo at ... http://www.youtube.com/watch?v=XXFRpox7JyM and adding a motion chart to a Google spreadsheet that students used to collect lab data and submit it using a form ... http://www.youtube.com/watch?v=60ugTMZ75vA. You can also import data collected with a form into a Fusion Table and map it!
For data sharing and compiling though, it'd be cool. The automated response summary is also very simple to use and quite helpful.

The Summary of Responses option (available from either the top of the page when editing the form or from the Form menu in the spreadsheet view) provides summary charts of responses like the one shown below.

You can also use conditional formatting so you can see certain patterns in a glance within the spreadsheet. What does that look like? The spreadsheet linked here has most numerical values color-code based on a related map keys. The color-coding is done automatically using conditional formatting. To set that up, select a column or set of cells, and select 'conditional formatting' from the 'Format' menu. You can find links to the maps on the page with the form embedded in it. That's here (still in draft form).


You could also use Spreadsheet Mapper to plot mappable data.  Note that last time I looked there was a very confusing error in Google's tutorial. It pointed to publishing the spreadsheet in a way that didn't work -- you should share through the option in the File menu, not through the Share button. Spreadsheet Mapper was used to create this map of Virtual Fieldwork Environments.


At the end of the post, I took the spreadsheet I shared back in 2009 of the Geoscientists' to do list and converted it into a form and embedded it in this blog post. The content of that form isn't mine -- it's lifted from Garry Hayes's Geotripper Blog.

When generating a form automatically from a spreadsheet, the default question format is for short text response. That's what is done below. You can also create the form which will automatically generate a spreadsheet.

I changed the first several questions to the different formats of questions available, just to show what they look like. The remaining questions I left in default format.

I didn't include the grid type question in the to do list as it didn't make sense for what's asked. Here is what a grid-type question looks like (along with a few other questions).


I set up the above little form just to see for myself what the grid-type looked like and how it fed the connected form, but I decided to make it something that might be useful for me, so fill it in if you'd like. It should only take a couple of minutes. Completing the form will also allow you to see the summary of responses, available upon form submission.

I've not used the grid before and if I was starting from scratch, I might use it for the whole geoscientists' to do list, with a two or three column grid (yes and no or yes, no, and partially/sort of).

Monday, October 24, 2011

Virtual Field Experiences in Geoscience Education: Resources from our GSA 2011 Short Course

Earlier this month, Frank Granshaw, Richard Kissel and Don Duggan-Haas convened a one-day short course in conjunction with the Geological Society of America's Annual Meeting in Minneapolis. It was a great day of networking and resource-sharing. This post is the agenda of that day with links to resources from each instructor.

A Photosynth of the GSA Short Course while Frank Granshaw was discussing VFEs and geocognition.

Course Agenda With Presentation Links
Introductions of instructors and participants + Goals of VFEs – Don Duggan-Haas,* Frank Granshaw* & Richard Kissel*
  • Click here for the introductory Prezi.
VFE in the secondary classroom – Sarah Miller, Deposit High School, Science; sarah@millerscience.com
  • Sarah’s Prezi
  • Sarah’s VFE (click Earth science, then Norwich)

VFEn design and geocognition – Frank Granshaw, Portland Community College, Portland, OR; fgransha@pdx.edu


Exploring the Great Japan Quake of 2011 with Google Earth – Steve Kluge, Resources for GeoScience Education; steve.kluge@gmail.com
Google Geo – Stefan Kuhne, Google, Geo Education Team; skuhne@google.com
VFEs in NASA Education Programs – Wendy Taylor, Arizona State University, Mars Education Program; Wendy.L.Taylor@asu.edu   & Phoebe Cohen pcohen@mit.edu 
Falls & Fossils: A Model Virtual Field Experience Focusing on Taughannock Falls State Park, NY – Richard Kissel, Paleontological Research Institution, Ithaca, NY; rak256@cornell.edu
The pedagogy of inquiry-based fieldwork – Eric Pyle, James Madison University, Geology & Environmental Science; pyleej@jmu.edu
Using Gigapixel Resolution Imagery for Exploration Across Scales – John Van Hoesen, Green Mountain College, Geology & Environmental Studies; vanhoesenj@greenmtn.edu
VFE Development as Self-Documenting Professional Development – Don  Duggan-Haas, Paleontological Research Institution, Ithaca, NY; dad55@cornell.edu

Friday, September 16, 2011

Connecting the New Framework for K-12 Science Education to Earth Science Bigger Ideas: An Updated Rainbow Chart

This summer, the National Research Council released A Framework for K-12 Science Education: Practices, Crosscutting Concepts, and Core Ideas.* This post provides a very, very brief overview of the new Framework and maps its Earth and Space Science Core Ideas onto the Bigger Earth System Science Ideas from the ReaL Earth Inquiry Project.


The Framework will be the guide for the development of the next generation of science standards. The National Science Education Standards (NSES) are due for an overhaul (or replacement) as they are now 15 years old.

NSES were a great step forward in the field of science education, bringing more focus upon inquiry and narrowing the overloaded curriculum, but they didn't go far enough. Furthermore, the great ideas in  NSES didn't make large changes in practices in the majority of classrooms. Fortunately, those ideas did filter to some classrooms and students. The new Framework also represents a great step forward (if its ideas impact classrooms).

The Framework describes science across three dimensions:
  1. Scientific and Engineering Practices
  2. Crosscutting Concepts
  3. Disciplinary Core Ideas
    • Physical Science
    • Life Science
    • Earth and Space Science
    • Engineering, Technology, and the Applications of Science
They are shown slightly expanded in Figure 1, below.


Figure 1: The Three Dimensions of A Framework for Science Education (from page ES-3) 

Just looking at the outline of the Framework's three dimensions highlights the scale of change the Next Generation Standards hope to bring. Only one of the three dimensions is focused on what we traditionally think of as science content, the rest, the majority, is focused on the nature of science. That's the stuff that helps us see where science comes from and why it matters. I think the first two dimensions are the most powerful pieces of this new document.

It's not the part I worked on. I was a member of the Earth & Space Science Design Team that drafted the Core Ideas for that section of the third dimension. While some of my fingerprints remain in that section, I was a bit player, especially since the Core Ideas in all areas were substantially revised after they left the hands of the Design Teams. (Even if my fingerprints were more clear in the Core Ideas, I'd still identify the other dimensions as more important). The impact of the revisions are most apparent in the fact that the so-called ideas are no longer ideas, but rather topics.

It's an idea that the Earth is a system of systems. Earth's systems is a topic. It's an idea that the flow of energy drives the cycling of matter. These ideas, or their close cousins, were in earlier drafts and I won't hesitate to say that I prefer them to the topics that made the final cut. But, I'm also very pleased that the Frameworks do bring focus to small sets of Core Ideas in each of four disciplinary areas. That has the potential for a much more coherent and manageable conceptual framework than anything from NSES.


Speaking of conceptual frameworks, you might be wondering how the Earth & Space Science Core Ideas map onto the Earth Science Bigger Ideas from the Regional and Local Earth Inquiry Project, and to the Essential Principles from the various Earth Systems Science Literacy Initiatives. (Ok, you might not be wondering that, but maybe you should).

The Prezi below includes an expanded version of the Rainbow Charts that map the various Big and Bigger Ideas, Core Ideas, and Essential Principles together, color-coded by Bigger Idea. Areas highlighted in white represent nature of science issues addressed by the overarching questions.


If you'd like to print a copy, you can follow the link embedded in the Prezi, or go here, or click on the thumbnail image below. It is formatted to print on legal-sized paper.


For more on Bigger Ideas, see:
I've not mentioned how the Framework sketches out how understandings of the Dimensions and Core Ideas are to be built over multiple years of instruction. That's hugely important and fundamental to why successful students have long graduated from school without deep understandings of basic science. 

This is but a very brief introduction to some of the ideas in the new Framework. If you're a science educator, (and if you're a parent, you're a science educator) you should give it a close look.


Don Duggan-Haas


*Clicking on the link will bring you to Framework page from National Academy Press where you can download the full document free as a pdf. All National Academy Press publications are now available as free pdfs.http://virtualfieldwork.org/downloadabledocs/BigRainbowChart09.2011.pdf

Wednesday, May 18, 2011

And suddenly, the inquiry evaporated!

Just like that, I was jumping through hoops, figuring out how to come up with fancy sounding answers and not really knowing what they meant. "Uh oh," I thought. Back away. Figure out what's good here, and what it's good for.

That was a close call.

I'm working on the new architecture for the Virtual Fieldwork Database, and I also am working on better understanding the geology of where we'll be doing our professional development workshops this summer. It seemed like a natural pairing. I think it is, but danger lurks in making things formulaic. It's needed, of course, to manage the work of classrooms, the work of scores of learners. But it is dangerous, at least if you want to foster critical thinking.

Here's the current draft of the VFE Database Entry Form. The fields in the form correspond to fields in the database. You can go ahead and play with it, but know that I may delete the whole thing as I work and rework the framework. It's a work in progress, so feedback is very much welcome.


Making a database that includes the kind of things you figure out about field sites makes good sense. It will be a powerful tool for comparing and contrasting field sites to one another. It will be sortable and color-coded and all kinds of cool things.

But don't let labeling things replace understanding things. As teachers and as learners we do that far too often. See the Traxoline Quiz (html) (pdf) for a powerful (if sort of silly) example. You can get every question right and have no clue what it's about (if it's about anything at all).

I was plugging stuff into the database about San Diego's Mission Trails Regional Park, where we'll be doing a workshop this June. We've still got some space -- apply here soon!

I was tracking down my sources, and entering in my information -- that the rock ranged in age from Middle Jurassic to Late Cretaceous and that the rock types included tonalite and quartz diorite, for example. That's when my "uh oh" moment hit me. Good hoop jumpers can add correct information to the database as easily as they can ace the Traxoline Quiz.

I wasn't letting our driving question: Why does this place look the way it does? do the driving. I was letting the (still emerging) structure of the database do the driving. Oops.

One of my most heavily used soundbites related to the project is that field trips, whether actual or virtual are too often characterized by teachers pointing things out rather than kids figuring things out. And I was headed down the wrong path. That doesn't mean that it's a fool's errand though. But it does mean that I need we need to be careful as we work to prepare our virtual (or actual) fieldwork experiences.

My gut says that key to avoiding this pitfall is to make sure that the database, or at least the entry of data about the site into the database, comes well into the experience for the learners. It's valuable for the learners to explore the field site with wonder on their mind. Of course a prescribed approach will need to come in eventually if we want to reach a point where the learner can read landscapes they've not seen before, and that's at least part of what we're after. My gut says if we rush that goal too much we simply won't get there. My gut also says that our driving question is a pretty darn good driver and I ought to let her drive.

What does your gut tell you?

Don Duggan-Haas

Thursday, April 28, 2011

On Crafting Virtual Fieldwork

How do you make a virtual fieldwork experience (VFE)? If you teach Earth or environmental science or history, you've almost certainly already virtually transported your students to another place. Since the invention of the story, teachers have taken learners to places virtually. Over the centuries, technologies have changed, making occasional leaps in the way we can represent the places we wish to teach about. The printing press, the slide projector, film and television, and the personal computer are perhaps the biggest leaps of technological representation used in the teaching of Earth and environmental science.

Computers have made it vastly easier to make virtual environments explorable as opposed to places told about, but it's always been doable. All you really need is a picture and you can begin to productively wonder, "Why does this place look the way it does?" As we noted in our opening post that question drives our work.

We want to perhaps start with wondering productively about a picture or a set of pictures, but we want to use the rich technologies available today to leap beyond that. This post is intended to help educators take a jump in that generative direction. The post addresses aspects of why to create virtual fieldwork and some about how to do so.

Why start locally?
One of the ultimate goals of this work is to have the learner being able to "read" landscapes and tell the stories that brought those landscapes about. We believe that the most logical place to start work on this is the place outside your door. We want to start with the local and familiar so that we can build on things our students know, work on problems that are relevant, and, then use those deepened understandings of the local environment to better understand the global environment.

We also want to start locally as we want the act of preparing the VFE to be a step toward engaging learners in actual fieldwork. While it's possible to develop a VFE without going to the actual field site (this is how many NASA scientists do their work), our work begins with the VFE author doing actual fieldwork. That gives the teacher/author a nudge to explore the local environment with an eye toward doing actual fieldwork. In other words, developing virtual fieldwork for your students is a logical precursor for doing actual fieldwork with your students.

Some tools to get you started
Toward that end, we've developed a set of questions that we think can be asked of any site. The questions support the project's driving question, again: Why does this place look the way it does? Those supporting questions are shown in the graphic organizer below and included in the packet available here. You'll also find them in a checklist at the end of the post.


Figure 1: The VFE Template's Graphic Organizer. All photos in shown in Figure 1 are from Oklahoma's Arbuckle Mountains. You can download the template as a PowerPoint or Keynote file here and replace the photos with those from any site. The questions are intentionally generic so that they may be asked of any site. They may also be changed to highlight special features of your field site.


Sunday, March 6, 2011

What's it like? Snow formation and analogies.

We don't understand something unless we understand what it's like. Looking for analogies is fundamental to making sense of the world and is therefore fundamental to what scientists do. Like the first entry, we'll again look to snow for analogous structures to things that we who teach Earth science often talk about, but don't often find within walking distance of our classroom doors.

The usefulness of analogies becomes more obvious, perhaps, when we get a bit further from home. As far as we know, no one has been to Mars, yet we have some pretty solid ideas about why the surface of Mars looks the way it does. The image below, and this link, link to, "A comprehensive image collection of rock breakdown features observed on boulders. This atlas is intended as a tool for planetary geoscientists and their students to assist in identifying surface features found on rocks on planetary surfaces."


It's loaded with images of rocks and the best scientific explanation of how they came to look the way that they do. What happens to rocks in one place is often a pretty good model for what happens to rocks somewhere else. Of course, that applies to a lot more than rocks. Looking for similarities while also being attentive to differences between situations applies to science and to life more generally. 

Analogy, and analogous features, was amongst the key points of the last post, Snow is a Rock Outcrop. For getting data on snow depths, there are almost certainly better places to go. The more important point was that having piles of snow in your schoolyard affords the opportunity to study something that is arguably a rock outcrop and certainly analogous to one. But, unlike most rock outcrops, it's right outside your classroom door (well, until last week, anyway)!

Since that post was written, a few ESPRIT listserv members have posted pictures of snow formations that are analogous to rock formations. (ESPRIT is an Earth science teacher listserv). I took a few too, and I invite folks to add more by linking to your pictures in the comments. Of course, we're about to be out of the snow season, so think of this as planting the seeds for things to do next winter.

This is also about looking; as in just paying attention to what is around you. Too often we forget to do that as I've written about on our Climate Change 101 Blog.

It's important to remember that analogies are never perfect -- and it's important to consider where the comparison fails. Thinking about that is a fine opportunity for critical thinking.

For the rest of the post, I'll simply share some photographs. They are groupings of snow formations with analogous rock formations, and it's really only a start and surely folks can find better pictures for some of these analogies. There are some more pictures here, and more were shared on the ESPRIT list.

Please feel free to add links to more relevant pictures in the comments.

A snow covered Adirondack stream. Photo by Michael Stark.

A snow covered Adirondack stream. Photo by Michael Stark.

Sulfur crystals around a volcanic vent, Hawaii. Photo by Allen MacFarlane.
Ice crystals near a sewer grate. Photo by Phil Medina.


Photo by Laura Rico-Beck.
Photo by Richard Gifford, via Flickr Commons.


Snow strata along a sidewalk after using a snowblower. Photo by Don Duggan-Haas.
A canyon wall. Photo by Frank Kehren, via Flickr.


Icicles within a snow bank. Photo by Don Duggan-Haas.
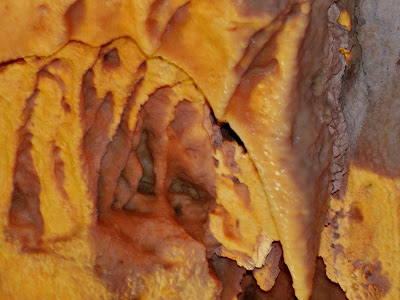
Stalactites and stalagmites, Natural Bridge Caverns, Texas. Photo by Don Duggan-Haas.
Stalactites, Natural Bridge Caverns, Texas. Photo by Don Duggan-Haas.  This photo is a combination of two exposures using HDRtist.

A weathered snowbank. Photo by Eric Fermann.
Weathered limestone in the Bahamas. Photo by Eric Fermann.


Frazil ice acts like lava in Yellowstone National Park.

Don Duggan-Haas

Wednesday, February 9, 2011

Snow is a rock outcrop

Information contained in nature ... allows us a partial reconstruction of the past. ... The development of the meanders in a river, increasing complexity of the Earth's crust ... are information-storing devices in the same manner that genetic systems are. ... Storing information means increasing the complexity of the mechanism.
~ Ramon Margalef as quoted in Meadows, 2008       
Most schools aren't located in places that are convenient to rock outcrops - except when it snows. As Margalef notes there are a variety of ways that nature stores information that allow us to reconstruct the past. This applies to rocks and snow as well as the examples listed above.

This post describes how to use a snow pit as a rock outcrop and offers a venue for sharing geo-located, time-stamped pictures and descriptions of your snow outcrop. The sharing can allow for correlation across outcrops, including those formed across much of the country during the Ground Hog's Day Blizzard of 2011.

The activity described here seizes the teachable moment -- substantial snow cover over a very large area. It may have imperfections as it was rushed to completion. Please use the last question in the form or the comments section of the blog to offer suggestions for improvement.

Snow is rock and sediment.
As a naturally occurring aggregate of mineral crystals, snow piled up on the ground meets the requirements of being a rock. It's a rock made of just one mineral and the mineral it's made up of is, of course, ice. Ice in the form of snow is a naturally occurring crystalline solid, formed through geologic processes with a characteristic chemical composition, a highly ordered atomic structure and specific physical properties. In other words, ice in the form of snow is a mineral.

Of course, when it first falls, it's just sediment, but it will typically consolidate to some degree as it melts, or before it melts. Frequently, through either compaction or melting and refreezing, the snow or layers within the snow, will harden into a single, massive unit over a large area. Rocks harden through a process of heating or baking, or through compaction and cementation, or a combination of these processes. Does that description apply to snow hardening into solid layers?

Just as limestone is typically made up of a single mineral (calcite), so is snow. Snow also forms in one of the ways that limestone forms -- it precipitates out of a supersaturated solution.

Like with the things typically thought of as sedimentary rocks, snow usually is deposited in horizontal layers, with the oldest layer at the bottom. The characteristics of those layers in either snow or rock, tell you something about the environment of formation and those characteristics can also tell you something about how the environment has changed since the materials formed.

If the snow is disturbed, by a snowplow or from sliding off of a metal roof, for example, you will likely find the characteristics of debris flows and avalanches. Perhaps you can find these in melting snow sliding off of cars. Where else might you look for such features? What other kinds of things might you look for? Please share your ideas in the comments section of the blog!

As there can be gaps in the rock record, so can there be gaps in the snow record. Uncomforities in the snow record form when the snow melts, or possibly when the wind clears some away, and, at least arguably, each time it stops precipitating for a while.

Snow is an opportunity for geologic fieldwork.
This provides a great opportunity. For a lot of reasons, it's difficult to get a class of middle or high school students outside to do geologic fieldwork. The distance to the nearest outcrop coupled with the duration of the class period makes it a big challenge. But if your school has more than a few centimeters of snow outside its doors, then, at least for the time being, doing at least a bit of fieldwork has gotten a whole lot easier!

Of course, you don't need to be a student or a teacher to engage in this study. 

If you've got time, there are possibilities for doing fascinating in depth study of snow, but that's not what suggested here (see the links at the end of the post for some resources for more detailed snow study). What is intended is a manageable way to engage people in the study of an outcrop. A primary goal of the activity is to provide students with the opportunity to study an outcrop and to correlate between outcrops.

What to do:
You may wish to dig a single pit or multiple pits. If this is done as a laboratory activity for a full class, it makes sense to dig multiple pits, and, even if you are working alone or in just a small group, digging two pits will help you see the correlation of layers across the schoolyard (or your backyard). Of course, if there is a lot of snow, a single pit may require a fair amount of effort to dig out.

Here's a video showing the most basic study of a snow pit.


Note that upon closer examination, the snow depth is closer to 25 cm (10 inches) than to 28 cm (11 inches)

  1. Equipment used may need to acclimate to outdoor temperatures before use. 
  2. You will take a picture or two. Check to see that your camera's date and time are set correctly as this will help in data sharing.
  3. Dig a snow pit like the one shown in the video. I used a garden spade shovel, with a flat blade. Any shovel should work - just scrape the face of the snow to a flat, vertical surface to finish the pit. If you are working in an area where the snow is over your head, you should receive safety training before digging.
  4. Brush the face of snow pit with a whisk broom or, if unavailable, the snow brush from a car. The brush will make the harder layers stand out more clearly.
  5. Run your ungloved finger down the face of the snow outcrop to detect the individual layers in the snow.
  6. To make the individual layers more apparent, insert markers at the top and bottom of each layer. Golf tees work nicely, but many substitutes are possible. I've done used golf tees in the picture below, and I numbered them to make the description easier. The tees are stuck in the snow at the tops of the most obvious layers, except for #3, as the layer is very thin (about 3mm). There is also no tee at the top of the top layer as the fresh snow is too fluffy to hold the marker.
  7. Record the thickness of each layer. Begin measurement from the ground up, as the ground's location will not change and the levels of the snow horizons will. 
  8. Complete the form below to share your data.

Figure 1. A snow profile with golf tees marking different layers. The ruler is vertical. There is some space between it and the bottom of the snow profile as the bottom layer was partially carved out.
 Figure 2. This photo zooms in on and labels to the photo in Figure 1.
Figure 3.  Spraying with colored water can make the layers more apparent. The photograph in Figure 3 was taken three days after those in Figures 1 and 2, and less than two meters away. See a 2 minute video here.
Below the form are some other things you might do or investigate.


You might also...
  1. Measure the hardness of the snow. Calibrate your finger hardness force.  Push on your cheek toward your teeth with your finger (no pain) or push on the tip of your nose (no pain).  The video here shows both how you use your fingers to measure snow hardness and a context where this really matters (avalanche forecasting).
    • Fist -- 10 g/cm²
    • Four fingers -- 25 g/cm²
    • One finger -- 100 g/cm²
    • Pencil -- 500 g/cm²
    • Knife -- 1000 g/cm²
  2. Study freshly fallen snowflakes with a magnifying glass or microscope. If possible, catch snow when it falls on black paper and look at with a magnifying glass or microscope. Research what the different flake shapes indicate about the environment of formation, or figure this out for yourself by collecting snow flakes under different weather conditions.
  3. Study snow from the snow pack with a magnifying glass or microscope. The characteristics of the snow changes fairly rapidly (it metamorphoses!) as snow accumulates on the ground. How does snow from the different layers of the profile appear different under magnification? What do these differences suggest? This kind of work parallels what would be done for geologists to correlate rock layers between outcrops.
  4. Record temperatures at different depths of snow. Is the snow of uniform temperature? 
  5. Investigate questions of your own.


What kinds of things can be learned by studying snow?
In this activity, we have used snow as a general model for studying rocks and rock outcrops. There are a great many other reasons to study snow. Here are a few links to further resources that relate to why you would study snow.
  • Dust and Snow: This news story describes scientists investigation of how dust can change the rates of melting snow, where the dust comes from and why dust matters.
  • Avalanche Prediction: This is one of several youtube videos that show how ski patrols and back country skiers study snow pits to determine the likelihood of avalanche.
  • Interdisciplinary Research: This youtube video from the National Science Foundation's Integrative Graduate Education and Research Traineeship (IGERT) Program hints at the range of kinds of scientists who might study snow.

Resources for more in depth snow study:

Learn about Google's Spreadsheet Mapper:
We expect to have the data available in both Google Map and Google Earth formats by using the data you provide and Google's Spreadsheet Mapper. Learn about it here


Content developed by the Paleontological Research Institution. Thanks to Bill Kean of University of Wisconsin, Milwaukee for his suggestions, to the students and teachers at Commonwealth Connections Academy, and, of course, to all the authors of the materials linked above.

Thursday, February 3, 2011

Welcome to the ReaL Earth System Science Blog!


Regional and Local Earth System Science is a National Science Foundation funded project of the Paleontological Research Institution and its Museum of the Earth that strives to help people study their local environment to help build their understandings of the Earth system.


We expect that the primary audience (and that some of our authors) of this blog will be educators -- both in and out of school. But we also hope to offer things to the genuinely curious person who wants to better understand our home planet and the piece of it that's in his or her backyard. 


In the ReaL Earth System Science project, we are developing curriculum resources while also engaging teachers in professional development. All of the work is driven by the question: Why does this place look the way it does? The "place" in question changes, but is intended to start with environments local to the school, (or wherever the learner may be) and to then use this understanding of the local environment to understand regional and global environments and processes. Materials development includes a series of regional Teacher Friendly Guides to the Earth system science of the U.S. 


The core of the professional development experience is engaging teachers in the creation of Virtual Fieldwork Experiences (VFEs). VFEs use electronic media to create representations of sites near participants' schools, thus adding to the materials we create in a way that engages our teachers as partners. 


Canyon Lake Gorge, Texas is a brand new gorge that formed after more than 30 inches of rain fell in just over a week. Our first teacher workshop of 2010 included the gorge as one of our field sites.

VFEs aren't intended to replace actual fieldwork -- we place a very high value on engaging students in the face-to-rock study of their local environment. VFE creation is intended to engage teachers in the close study of their local environment with an eye towards engaging students in actual fieldwork. Further, VFEs can be used to both prepare students to enter the field and as a way to process this work after the fact. In the ideal situation, students are co-creators of VFEs. 

This blog is intended as a space for sharing resources related to the project. It will include project staff writing about resources they've created, but more importantly it will be a place for project teachers to share their work. Look to this blog to find:

  • Resources created by project staff to help teachers and their students study environments at scales ranging from the microscopic to the global;
  • Teachers sharing resources they've created;
  • Discussions about pedagogy and curriculum design;
  • "How tos" on the use of technological tools for the creation of materials for learning and teaching;
  • Information about our professional development offerings; and;
  • more!
We are more concerned with engaging people effectively in investigating why places looks the way they do than we are interested in arriving at a specific answer. While we certainly hope and expect that the educators that we work with, and the students that they work with, will be able to tell the story of how their particular environment came to be the way that it is, ultimately we believe it is more important that the learners in our charge learn how to investigate than to describe the particular processes that created their local landscape.